- **Total Value Creation**:
- **Gradual Decrease in Value Creation**:
- **Team Makeup and Descriptions**:
- **Methodologies**:
- **Advice**:
Survey Changes Over Time
Between 2020 and 2024 (see 2020, 2023, and 2024 for each year’s information), I’ve been conducting a data teams survey. I wanted to dedicate an entire post to examining the change in data teams over time.
Total Value Creation
The most important question I ask each year concerns data team value creation. I break the question into two parts: “How successful would the business say your projects are?” and “How successful do you think your big data projects are?” This division into two questions is essential to distinguishing what a technical person thinks from what the business thinks.
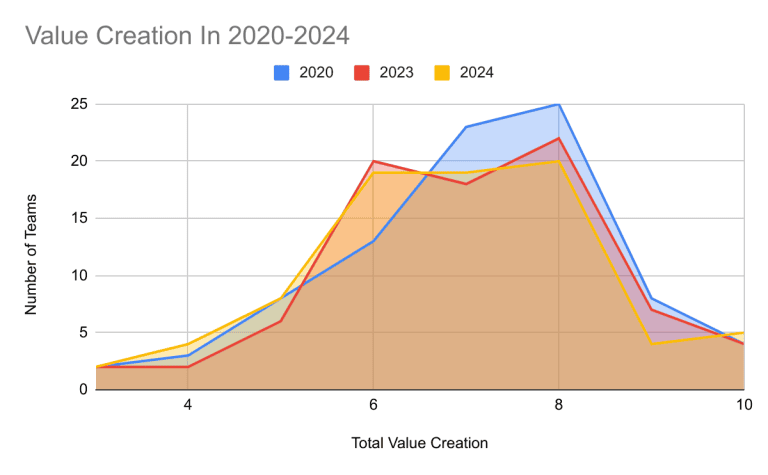
I’ve found perceptions of success to be highly varied. To achieve a higher level of success, I asked two questions. I asked respondents how they felt and what the business would say about the success (the higher the number, the more successful the project). From the responses, the individuals thought that the business would say they’re more successful than what they would say. To get a combined view of the business and personal opinions of success, I added the two numbers to get a range of 1 to 10. This combination showed predominantly 6 to 8 ratings from respondents.
We are gradually generating lower amounts of value over time. This trend is huge and should give everyone in the industry pause.
I’ve been seeing this lower value creation trend anecdotally, and now we see it in the data. For a nascent industry like data teams, we should gradually increase the amount of value created or, at a minimum, stay the same.
This downward trend has been troubling me for some time. In 2023’s survey, I said, “I hoped and expected to see higher value creation in 2023 compared to 2020. The chart doesn’t show any meaningful changes. The average for 2023 is 7.02, and in 2020 is 7.08. It is concerning to me that there wasn’t an increase in value creation over three years.” In 2024, we’re at an average of 6.8.
Another way to view the lower value generation over time is to look at the raw numbers. We see a gradual decrease in numbers 7, 8, and 9 over time, which is very concerning.
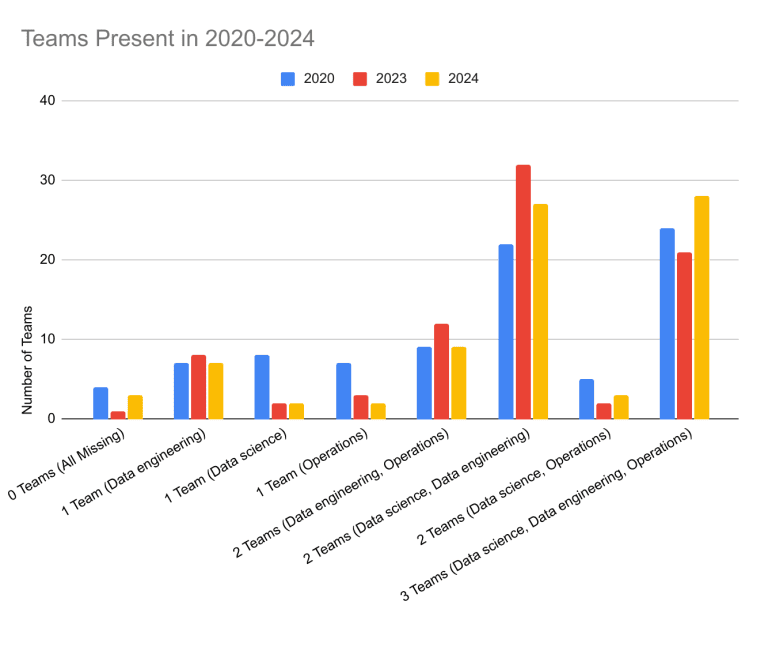
Regarding team makeups, we see a gradual decline in single teams and an increase in all three teams. This increase in three teams is a step in the right direction.
Regarding team makeups, we see a gradual decline in single teams and an increase in all three teams. This increase in three teams is a step in the right direction.
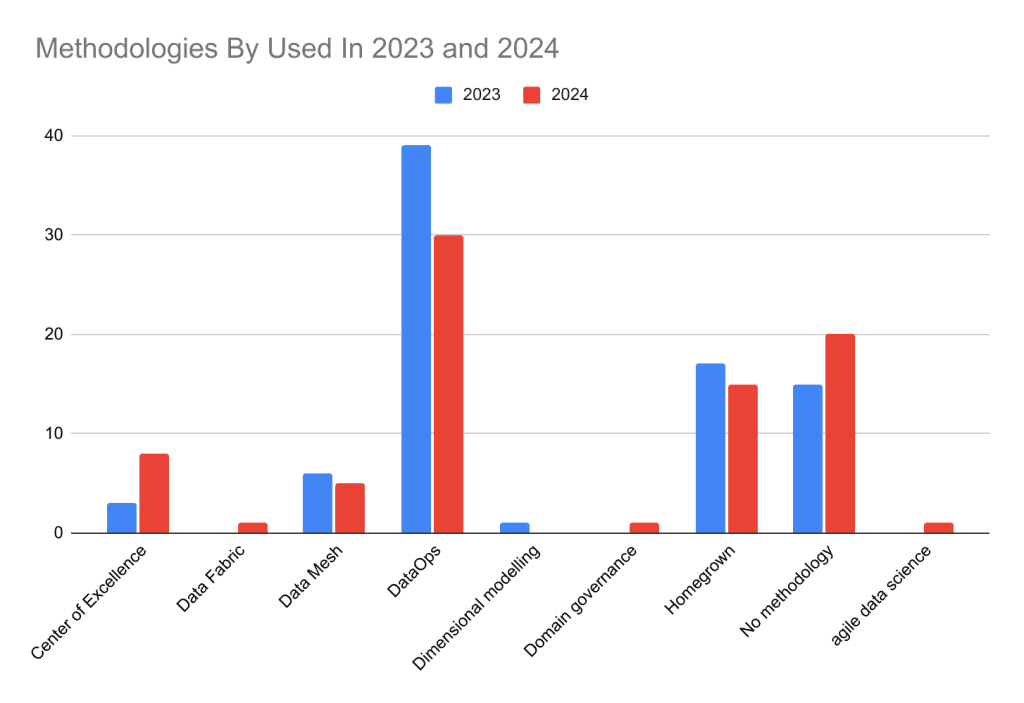
Methodologies are changing, too. We see a decline in DataOps and an increase in teams not using a methodology. Choosing a methodology is still essential.
Advice
Given the trends from 2020 to 2024, management needs to make changes now. We need to examine the amount of value we’re generating and find ways to increase it.
There are some hard lessons in history for teams that don’t generate value. We don’t have to look far into the past to see what happened with data warehouse teams. Their lack of value creation and collaboration with the business has made them an anachronism to startups.
It’s incumbent upon us to increase business alignment and communicate the value of what we do with the business and stakeholders. This is one of the common issues that data teams report each year during the survey. Stay tuned, as I have some ideas on how to improve this for data teams.
It’s incumbent upon us to increase business alignment and communicate the value of what we do with the business and stakeholders. This is one of the common issues that data teams report each year during the survey. Stay tuned, as I have some ideas on how to improve this for data teams.


