
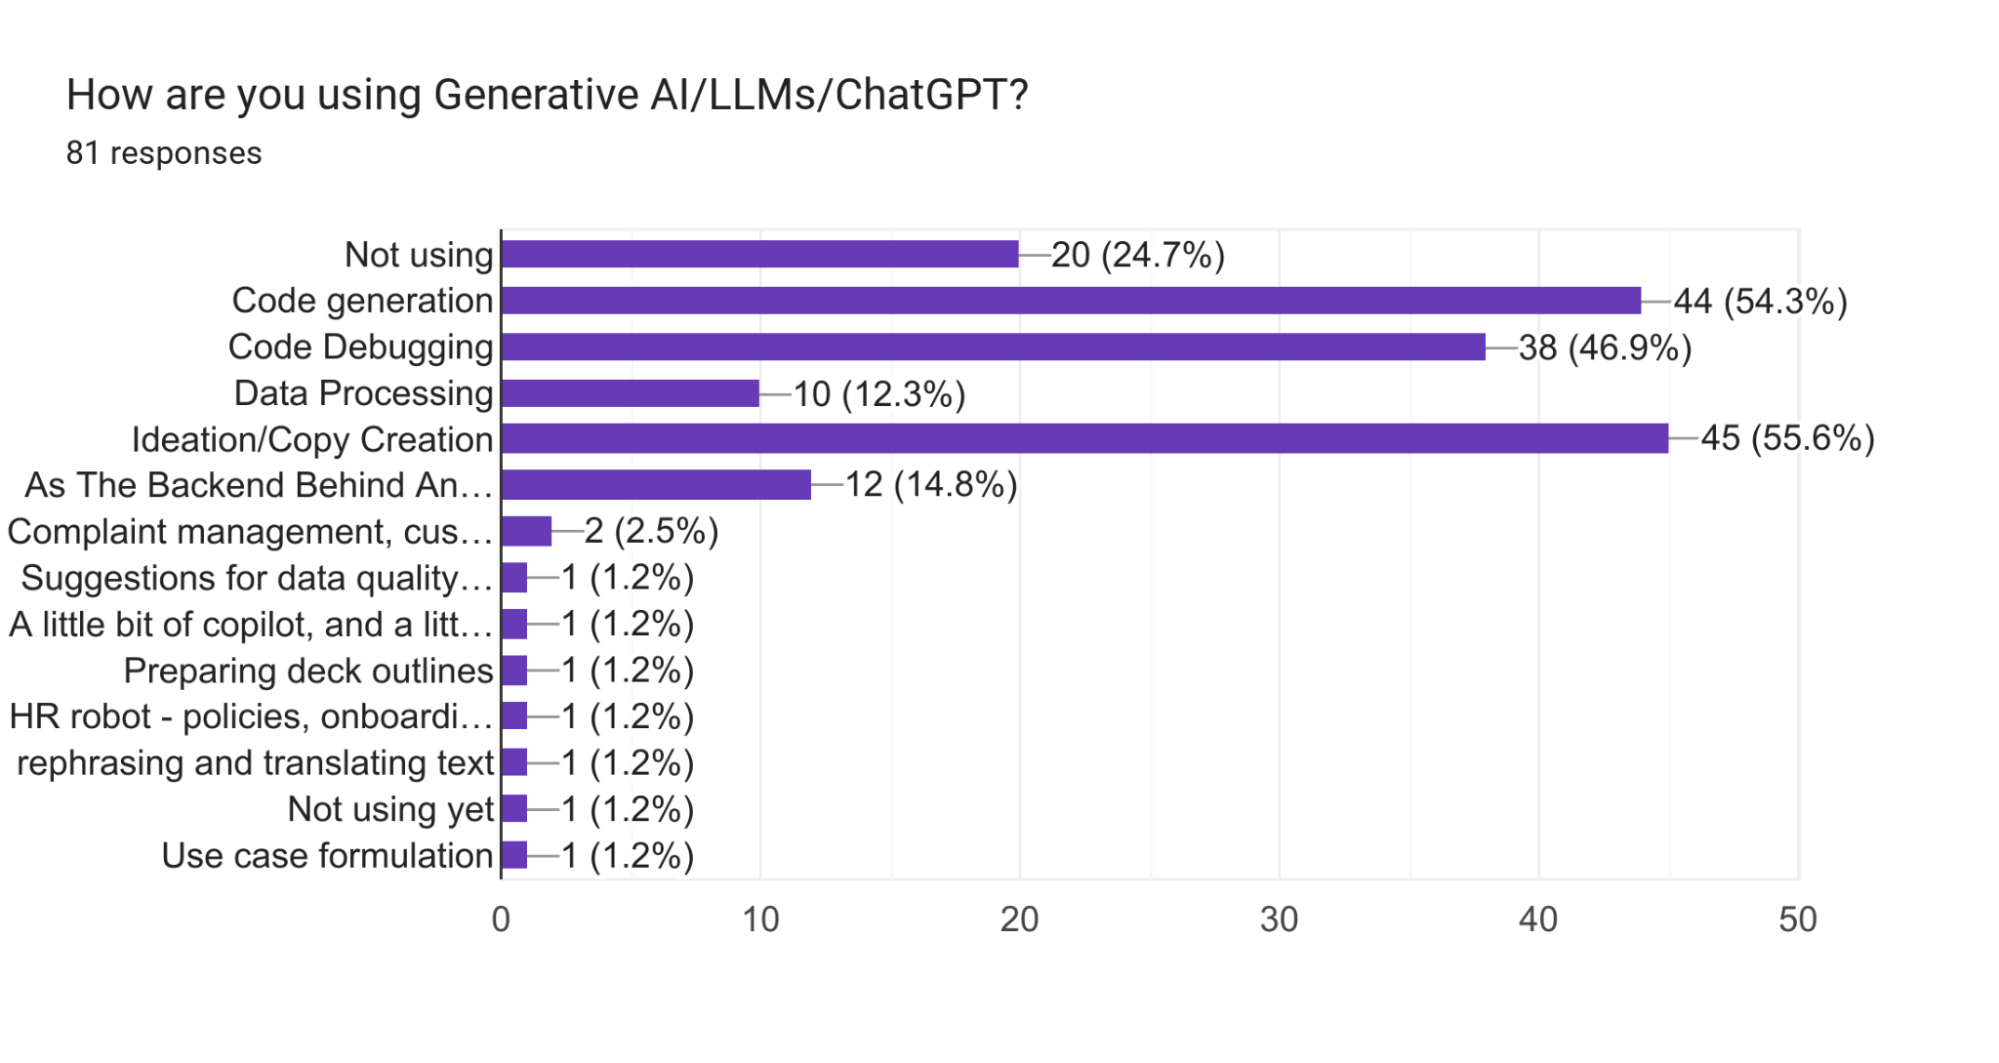
- Companies are not fully utilizing LLMs in data engineering, with 24.7% of teams not using them at all.
- Only 12% of teams are using LLMs for data processing, the most ideal use.
- Challenges in using LLMs include concerns about human-generated data, costs, and long response times.
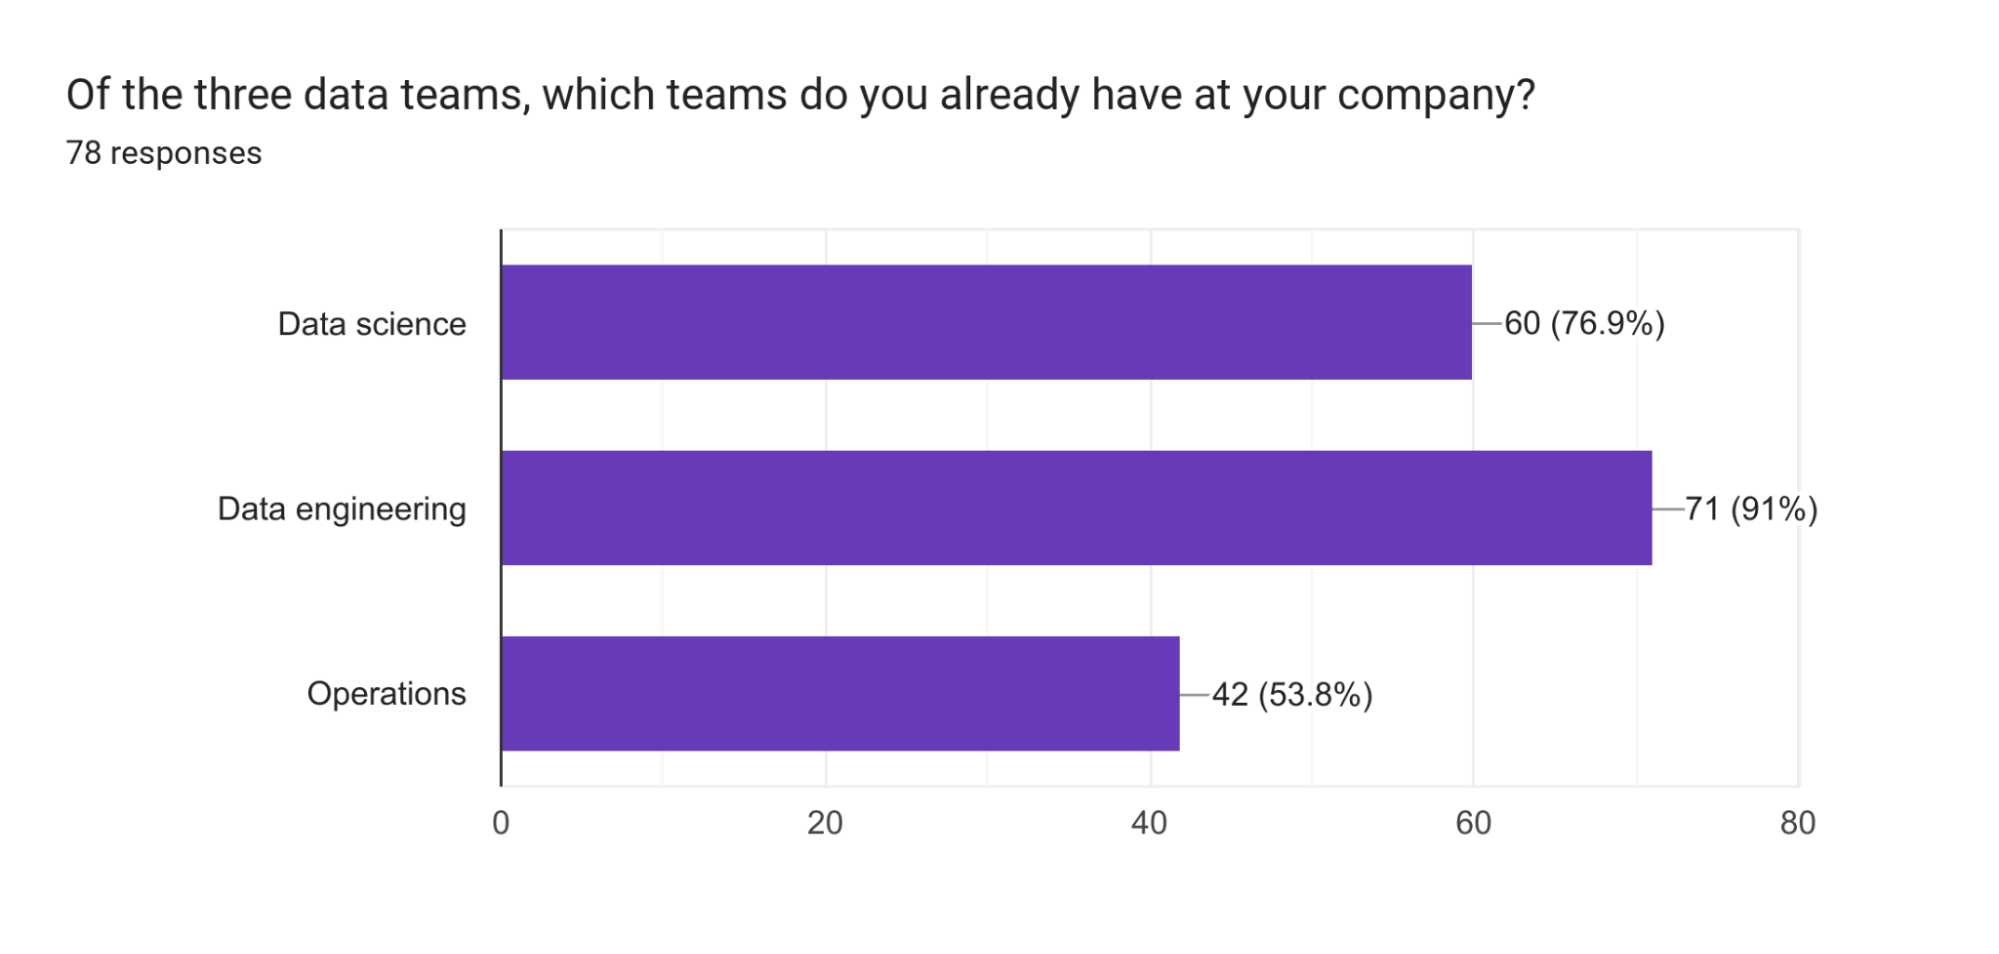
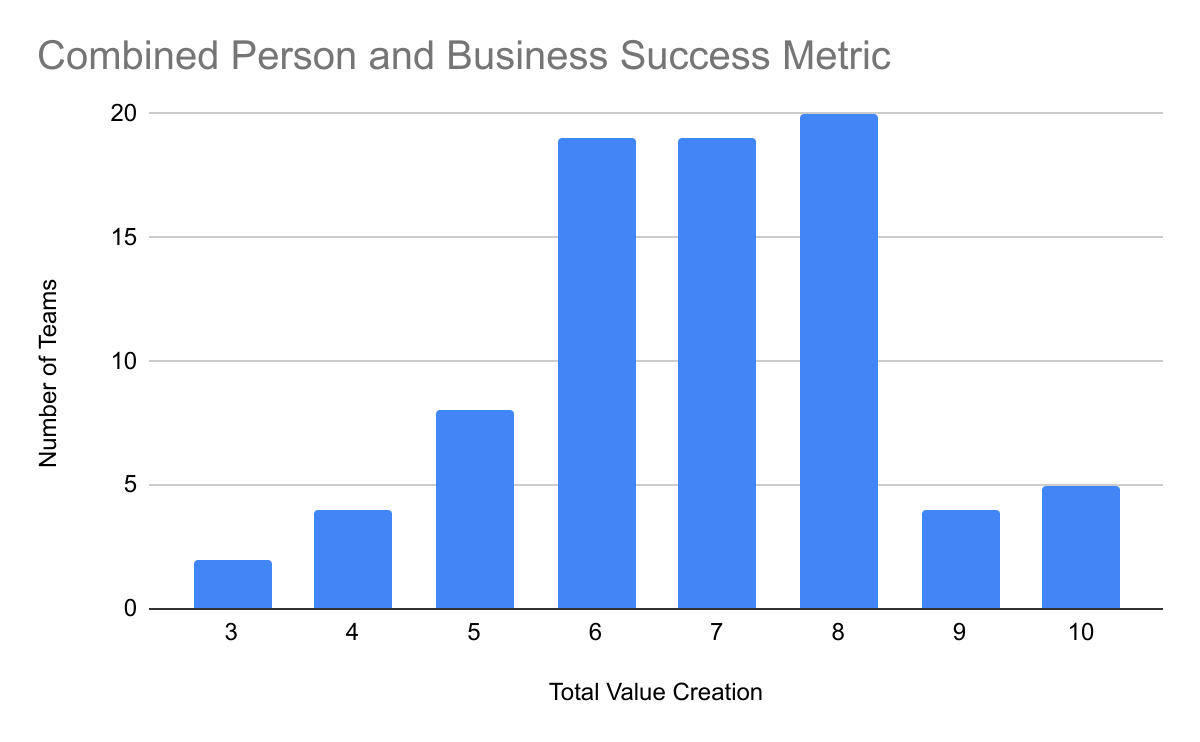
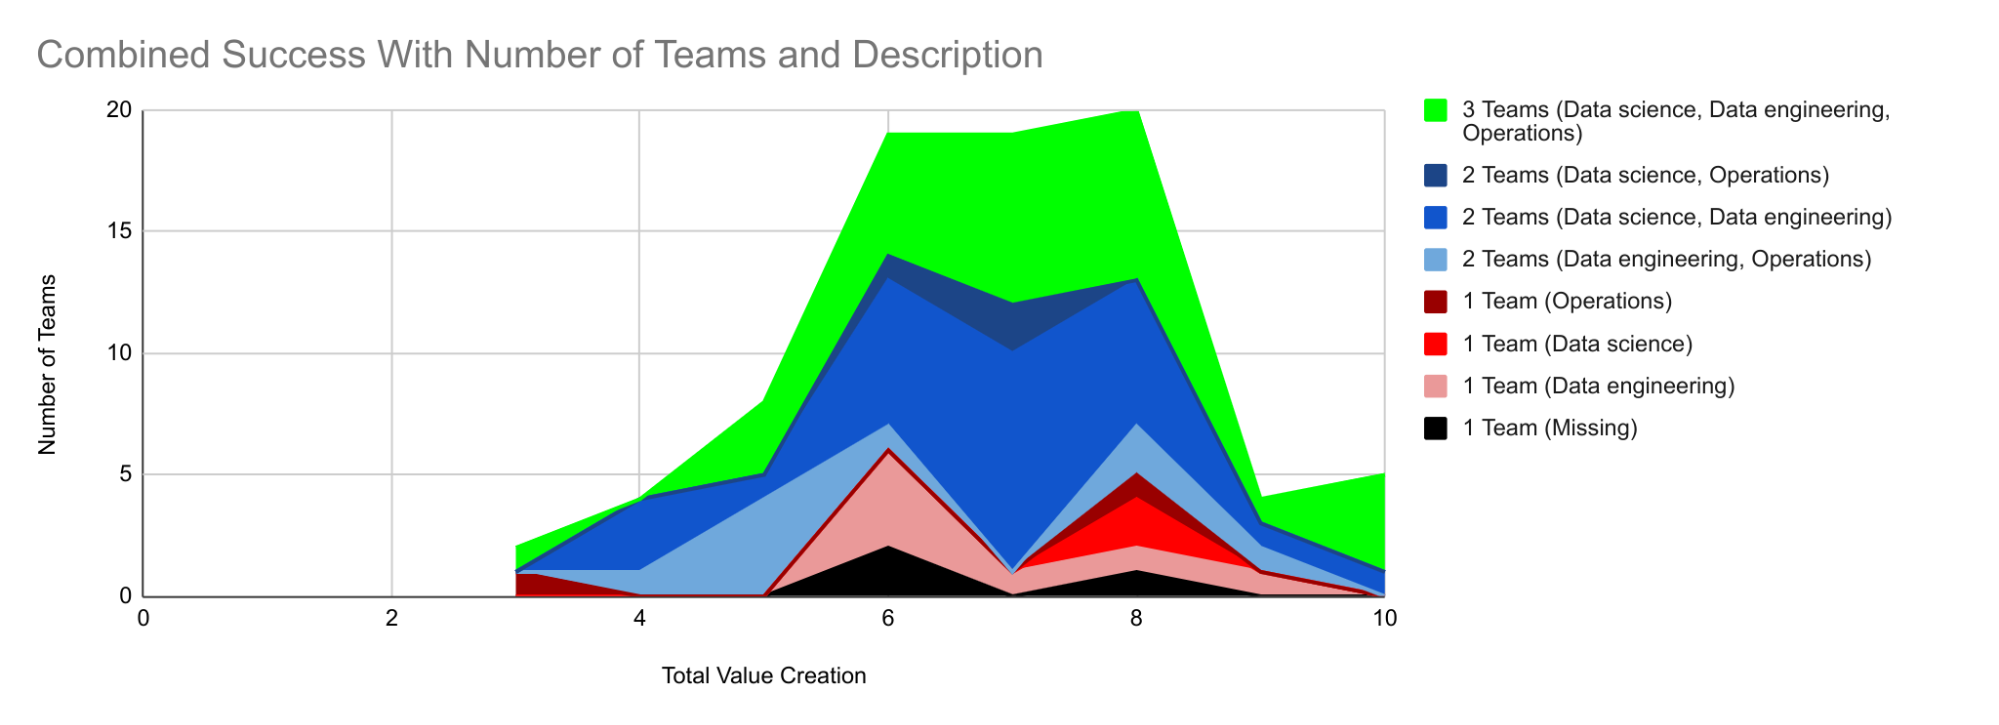
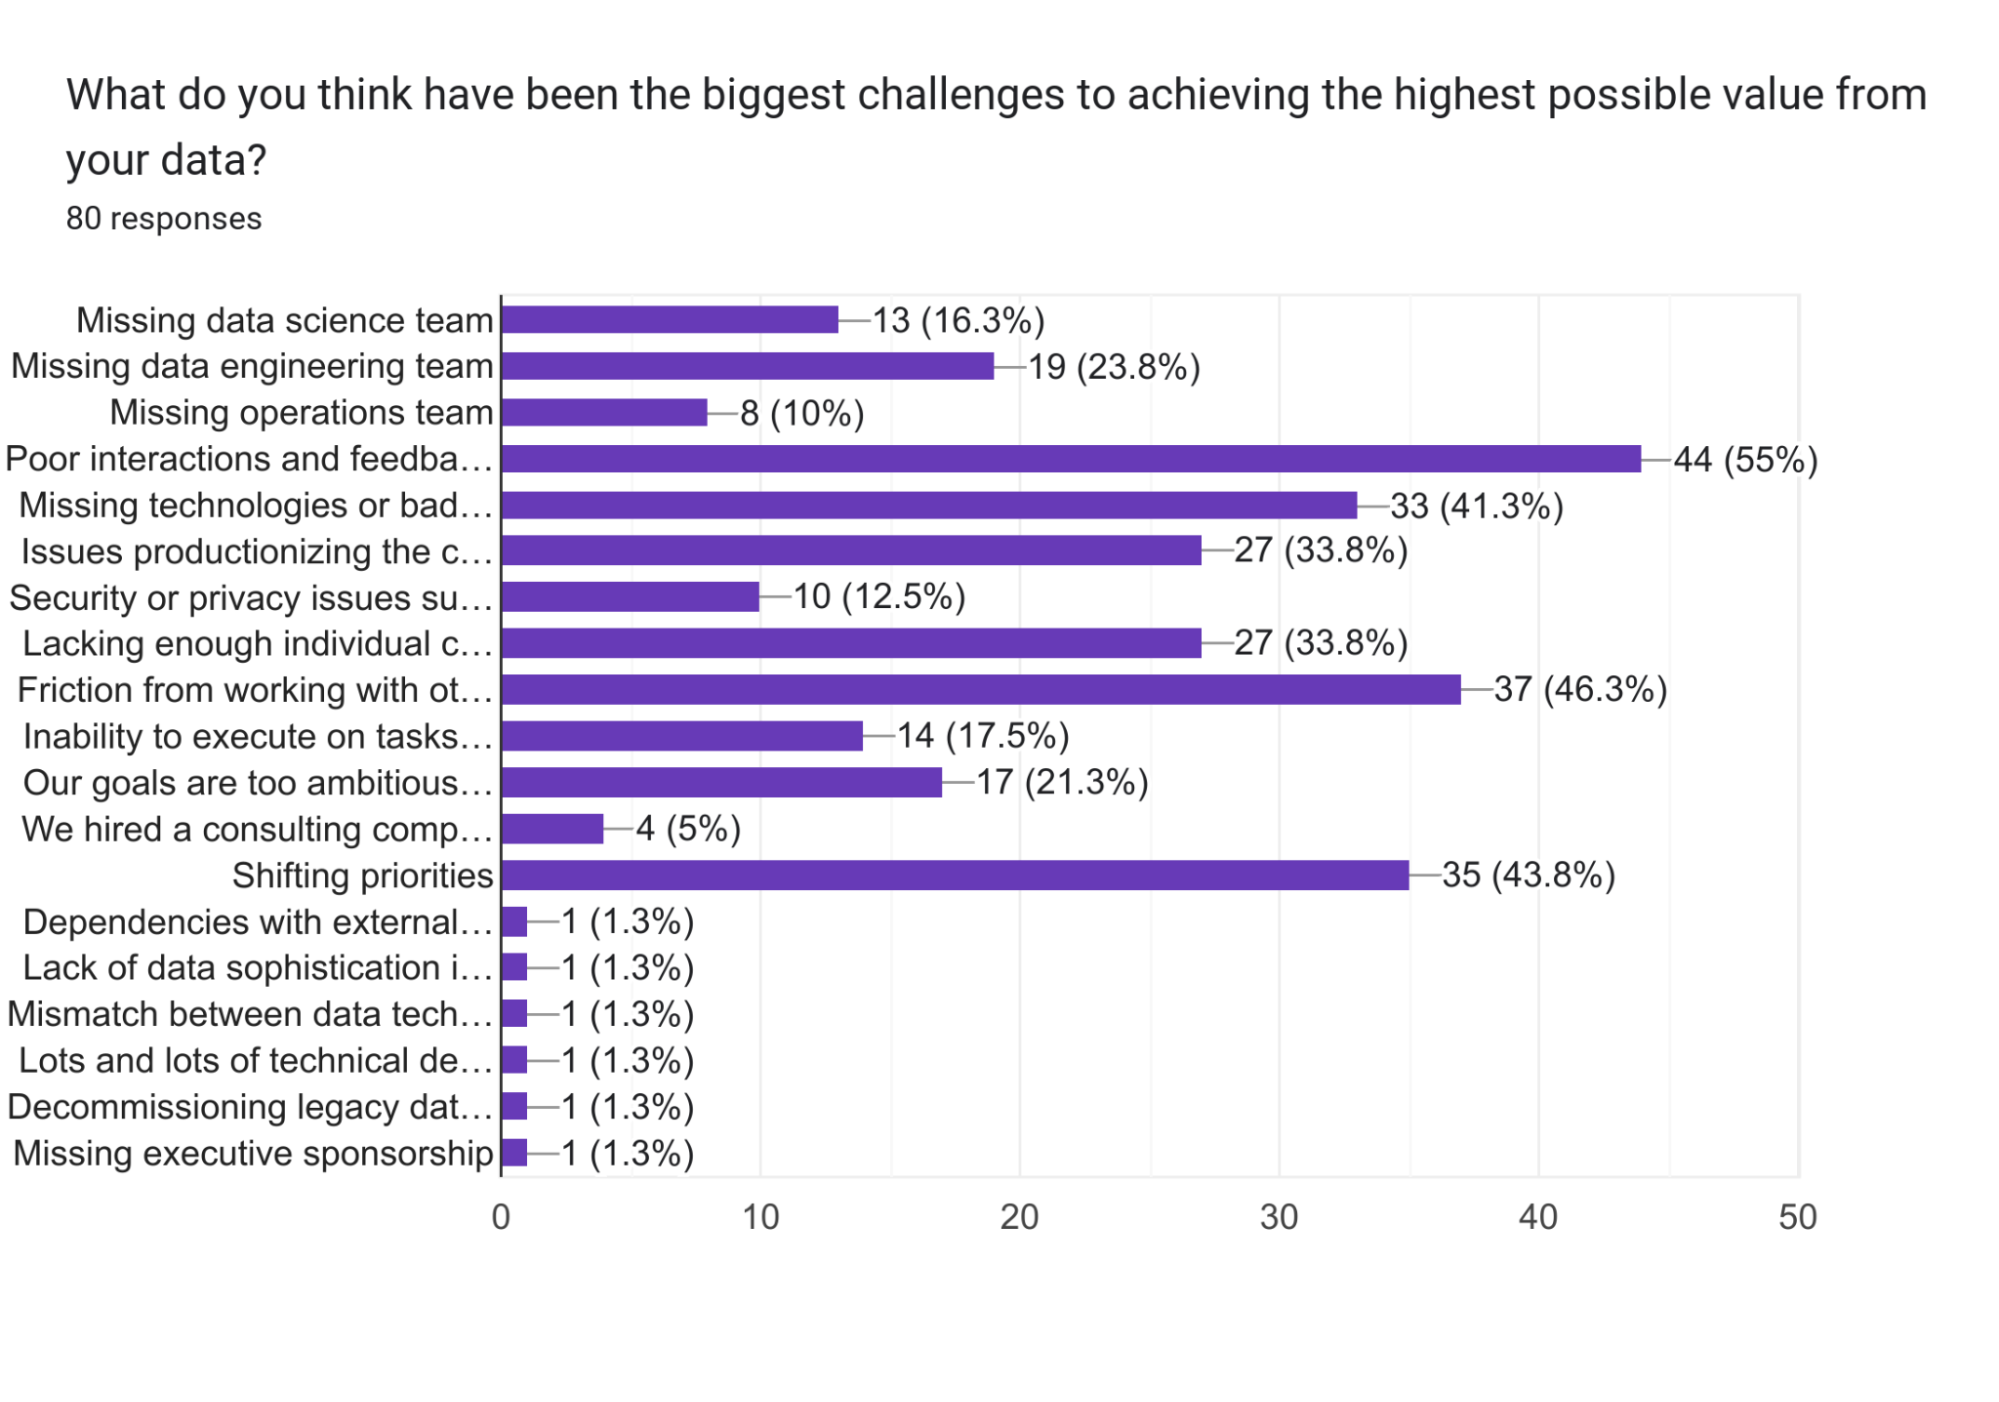
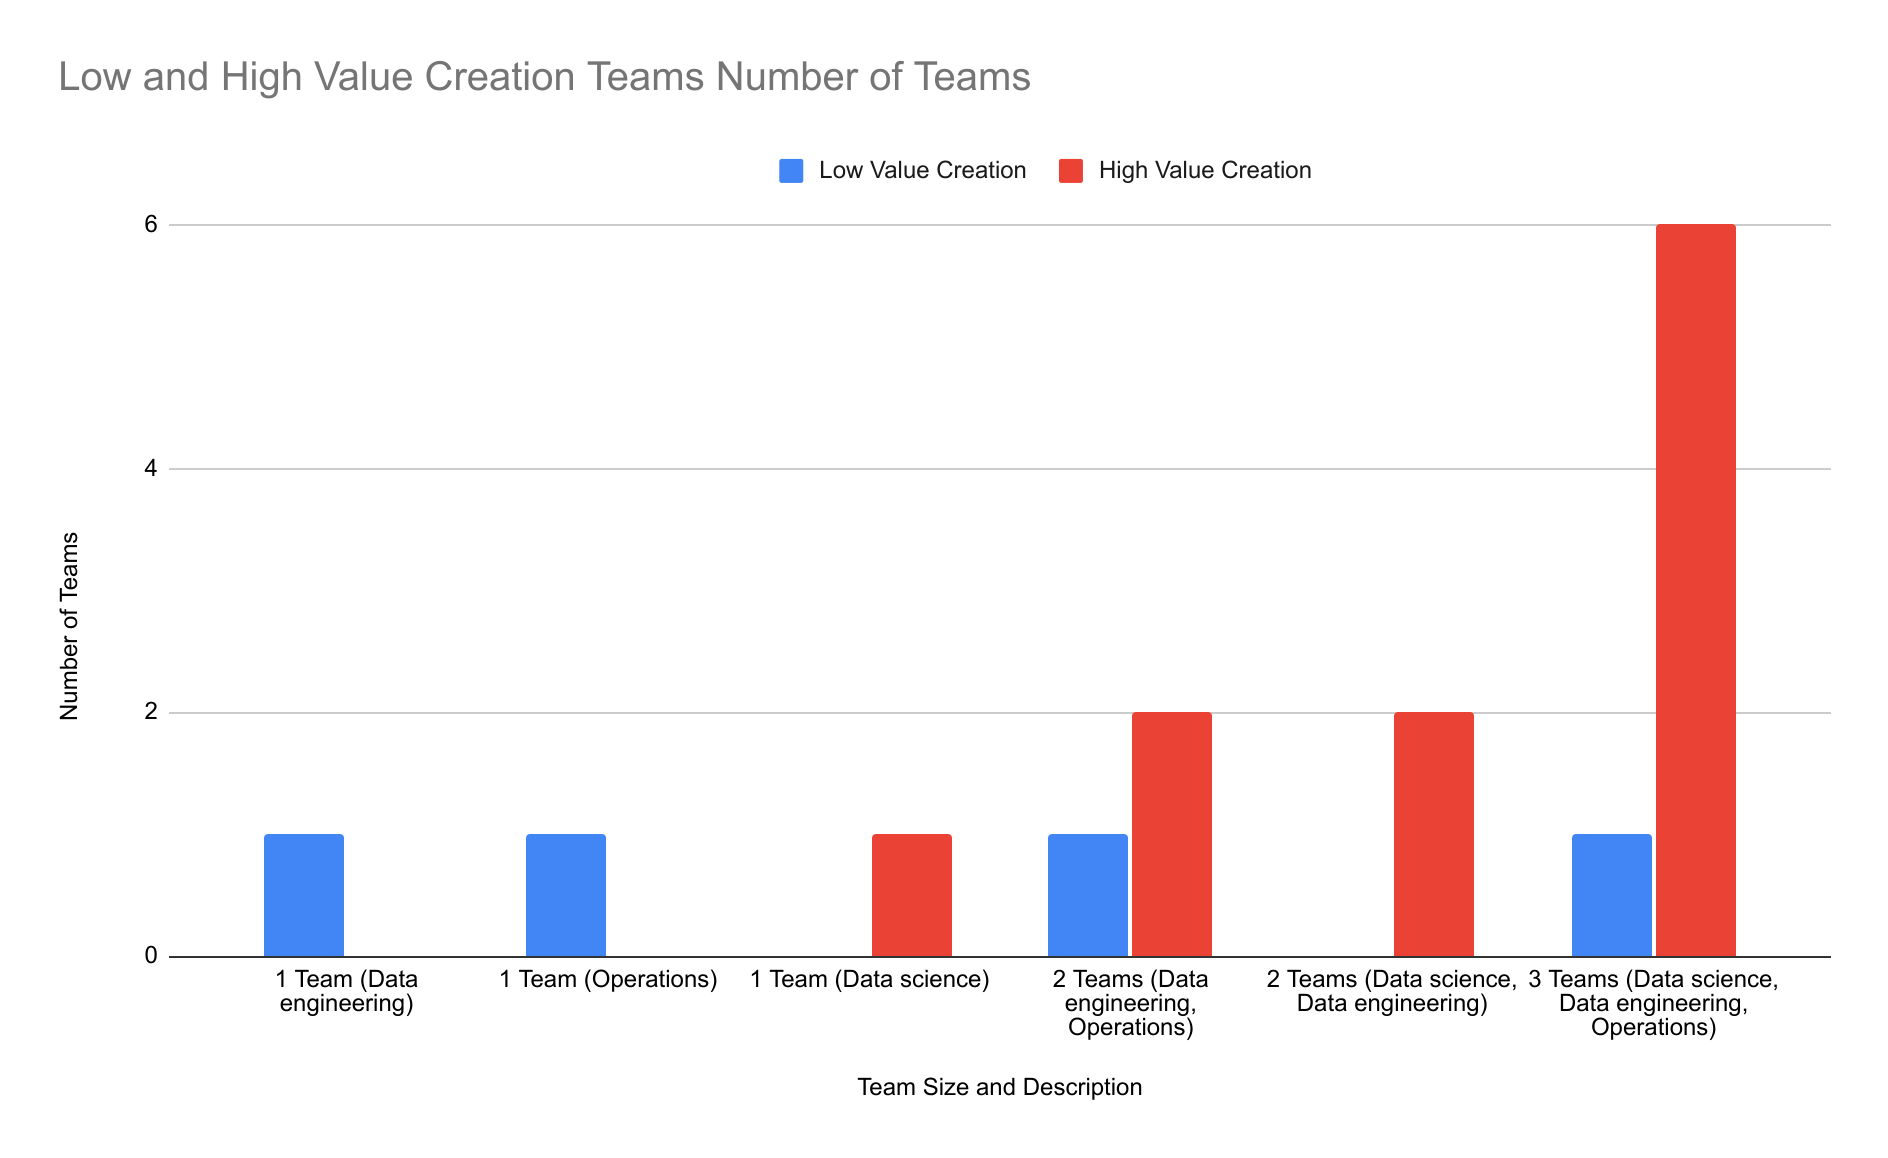
- Data science, engineering, and operations are essential for successful data projects.
- Operations teams are lacking in half of the respondents, indicating a need for improvement in team representation.
Frequently Asked Questions (AI FAQ by Summarizes)What is the significance of the release of LLMs in 2024?
The release of LLMs in 2024 significantly improved handling human language in data engineering.
What percentage of data teams are not utilizing LLMs?
24.7% of teams are not using LLMs at all.
What is considered the most ideal use of LLMs?
Only 12% of teams are using LLMs for data processing, which is considered the most ideal use.
What are some challenges in using LLMs?
Challenges in using LLMs include concerns about human-generated data, costs, and long response times.
What are the key roles needed for successful data projects?
Companies need data science, engineering, and operations to succeed in data projects.
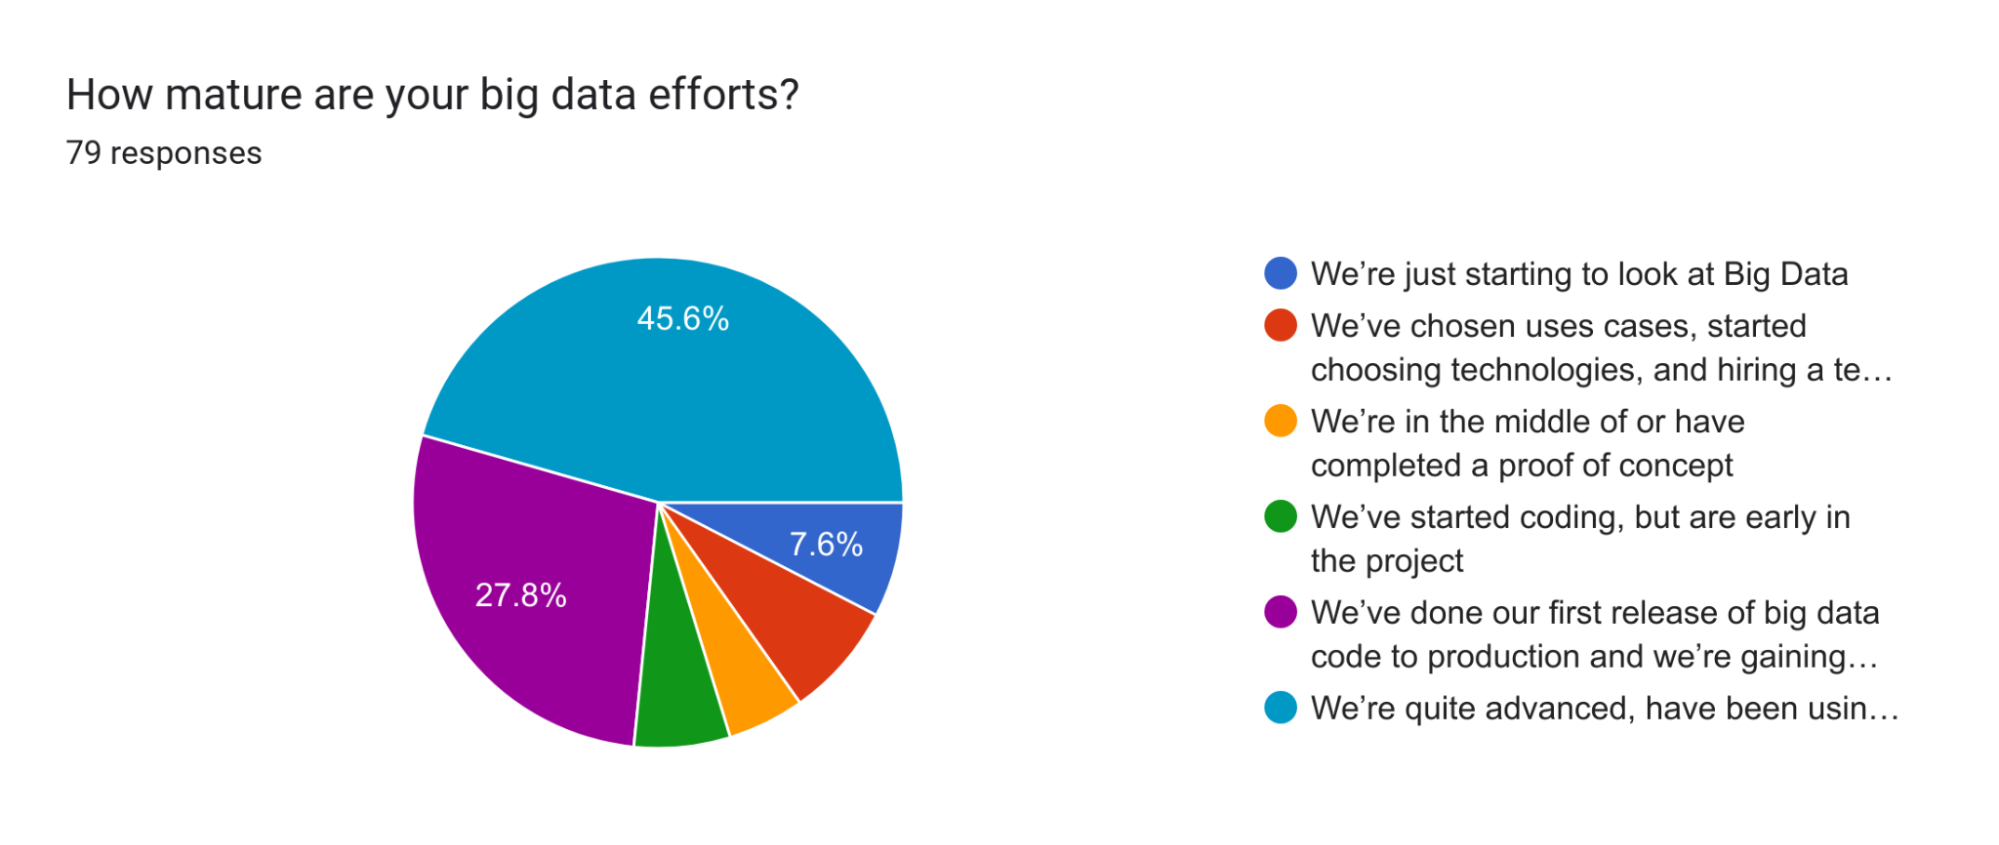
What percentage of respondents are in production or further along in their big data journey?
73.4% of respondents are in production or further along in their big data journey.
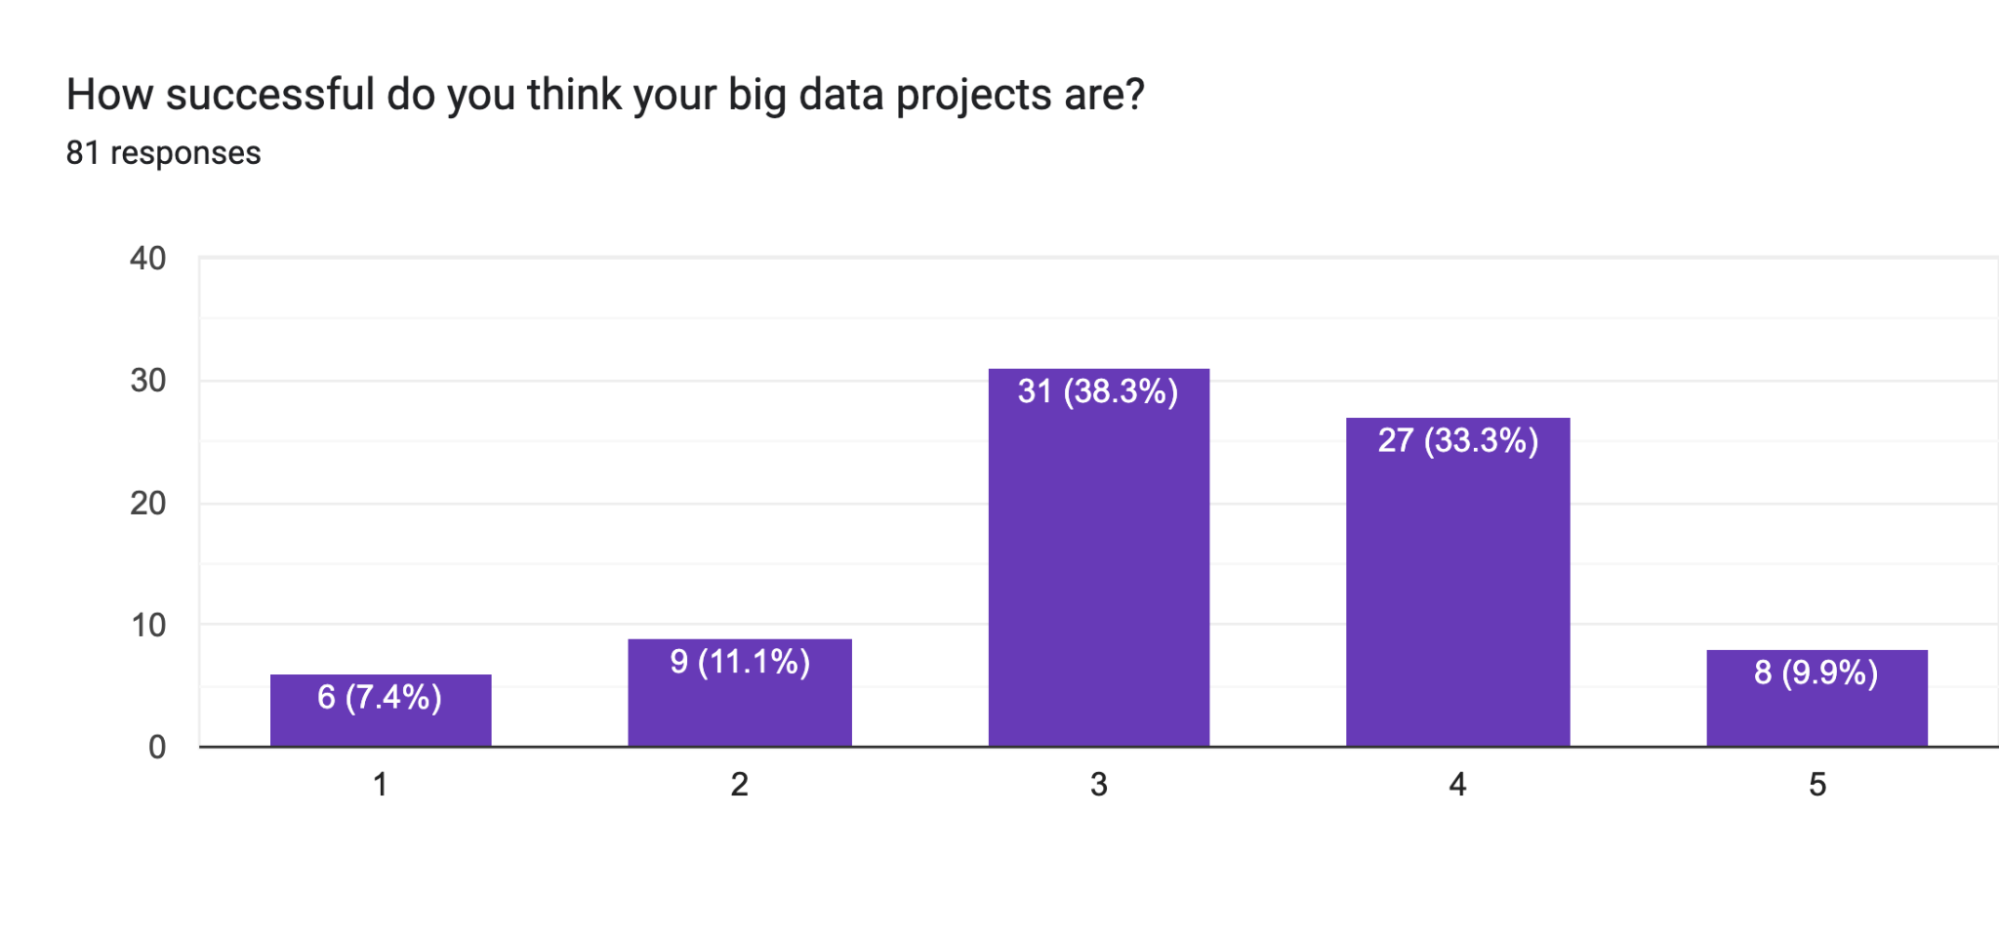
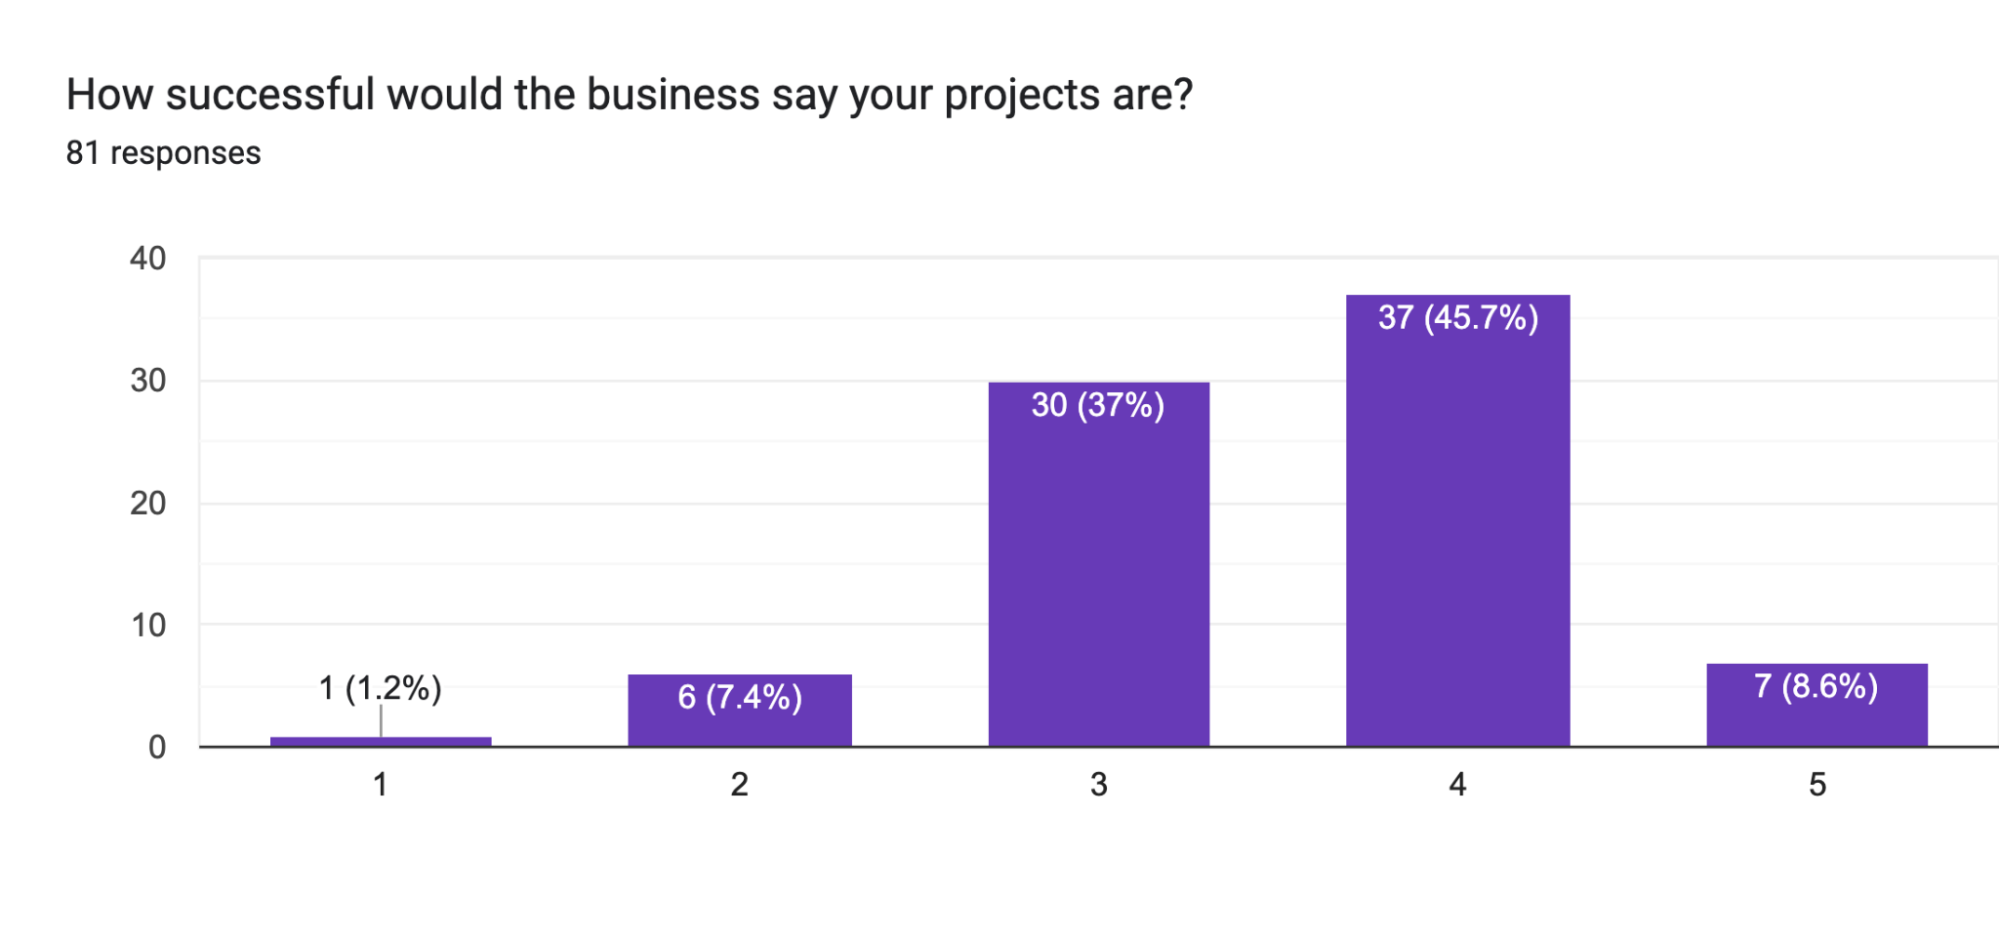
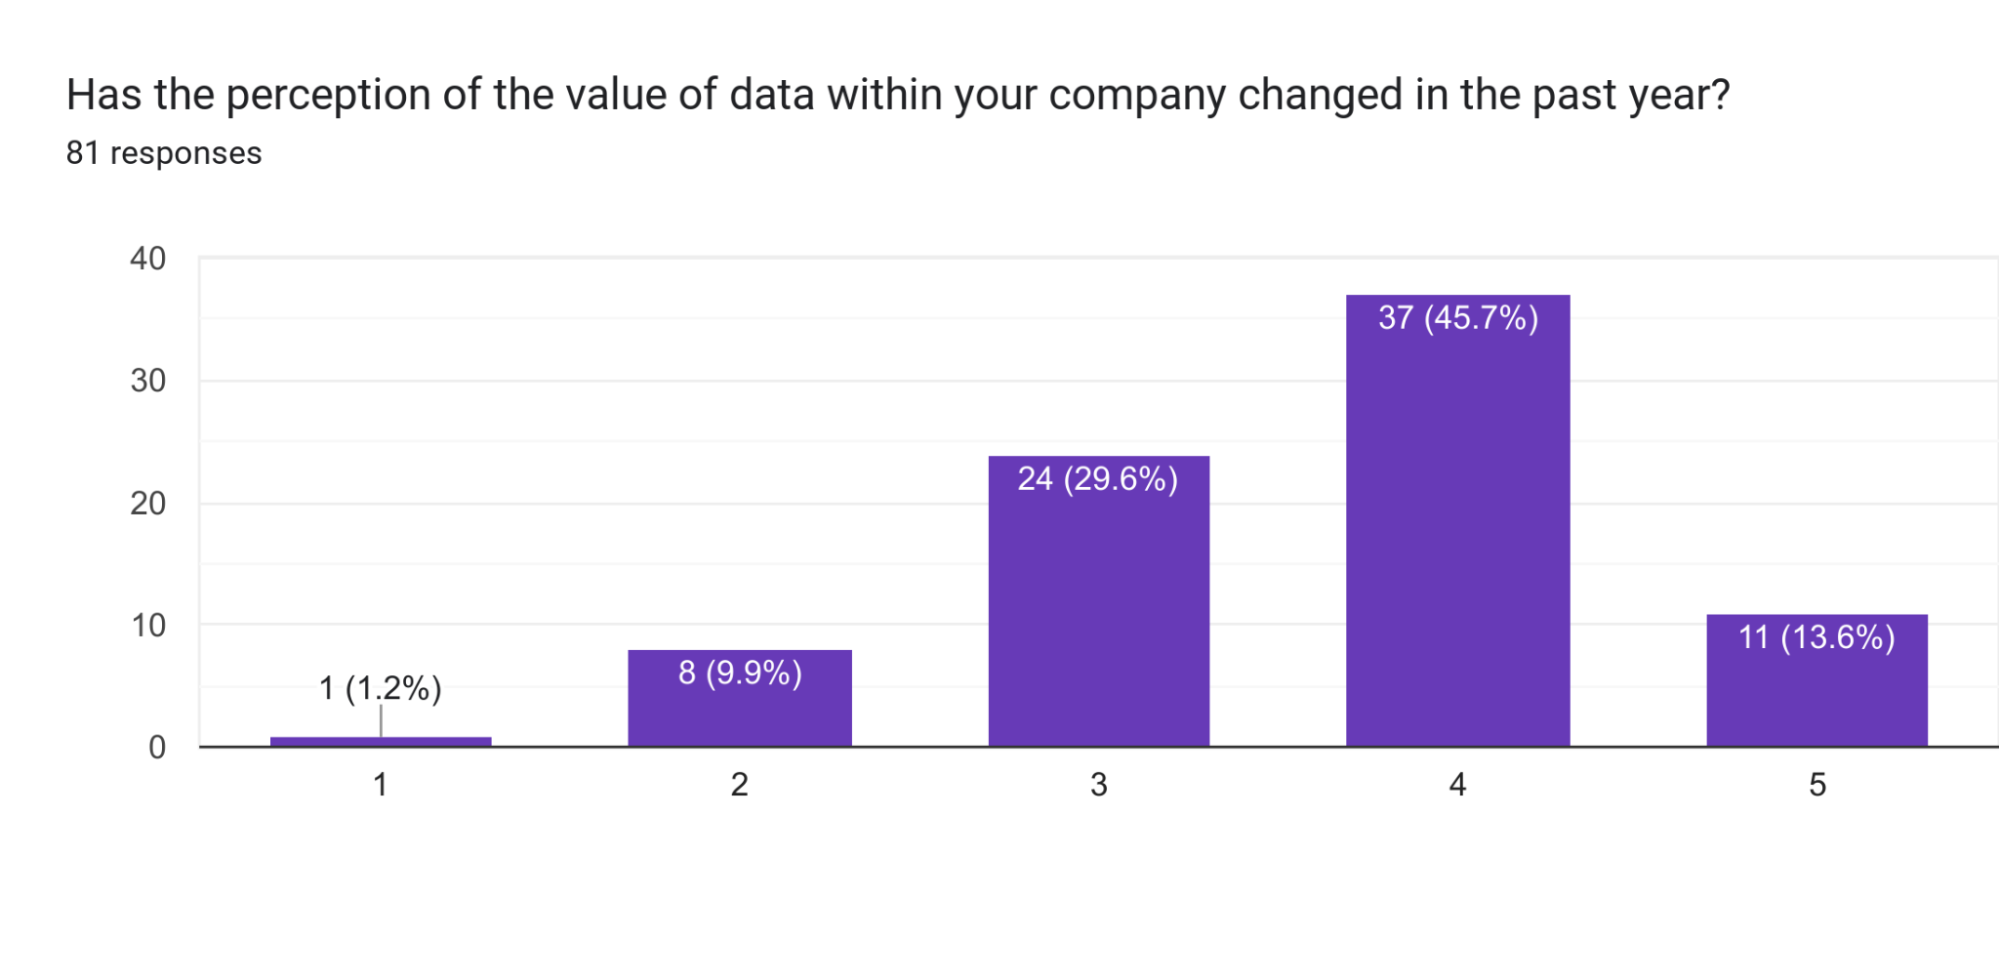
How does the perception of success vary in data projects?
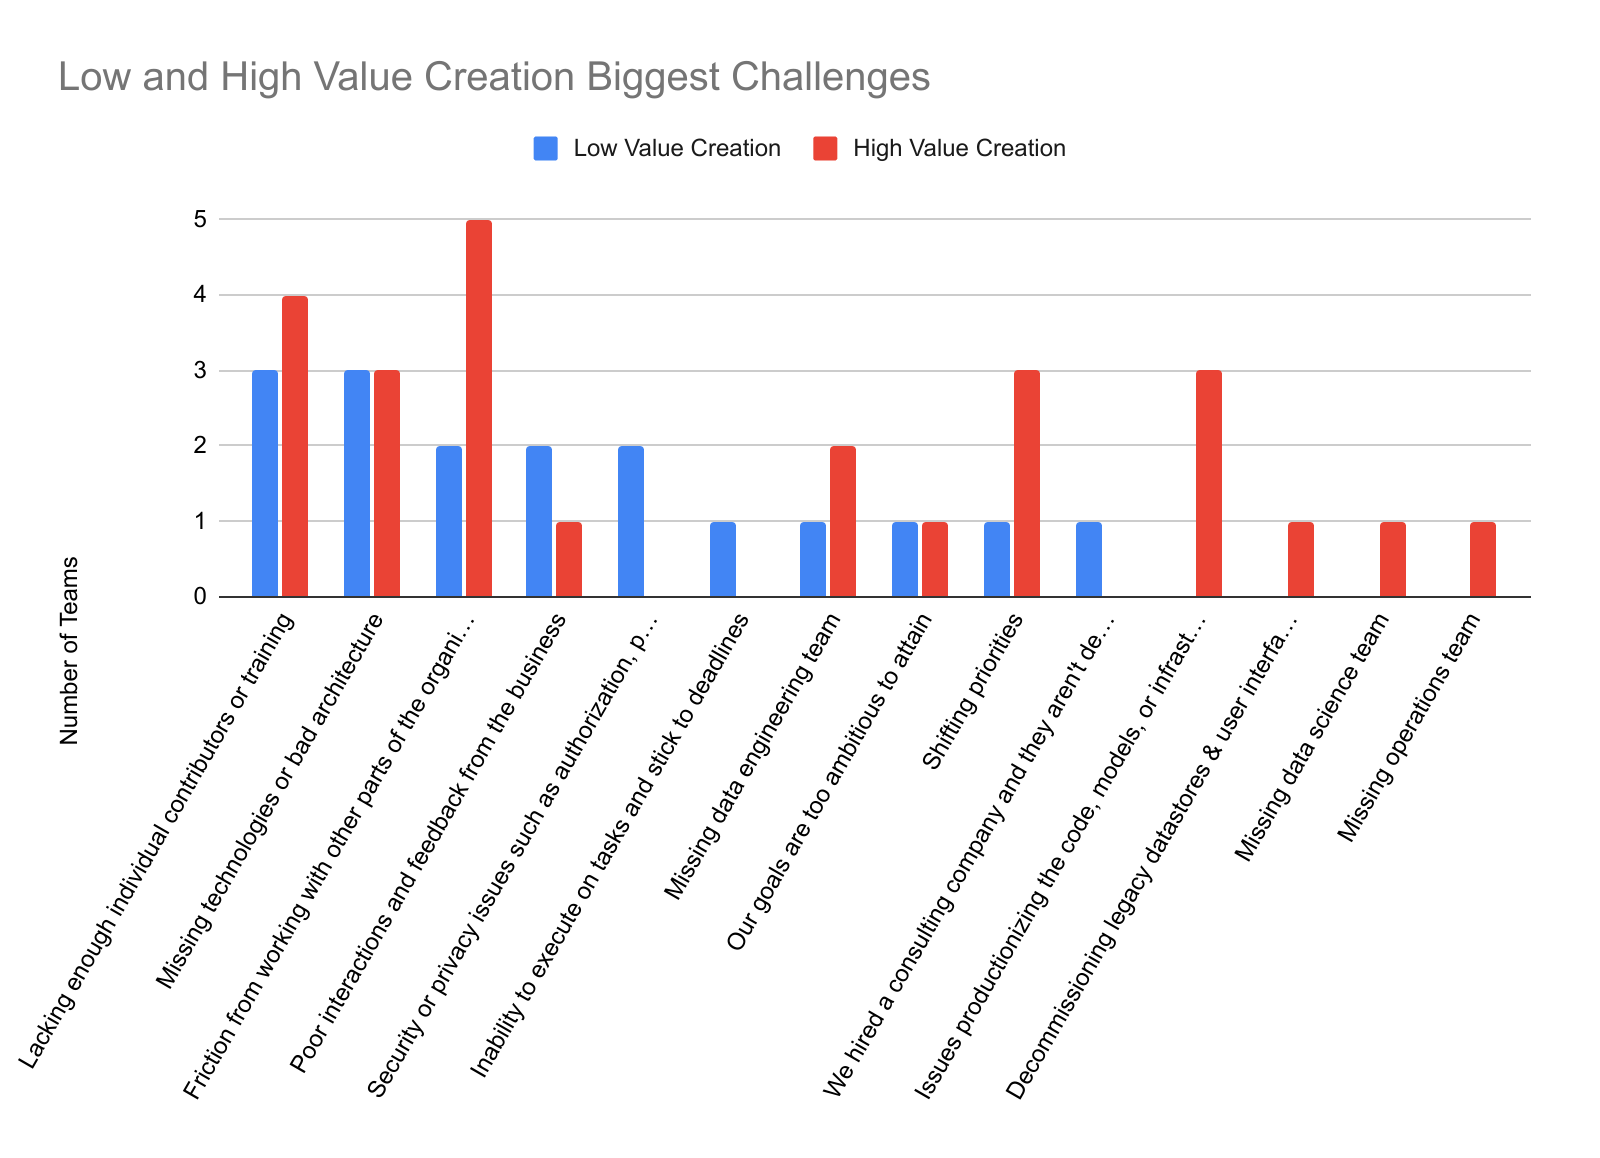
The perception of success varies, with individuals often rating their success higher than what the business would rate.
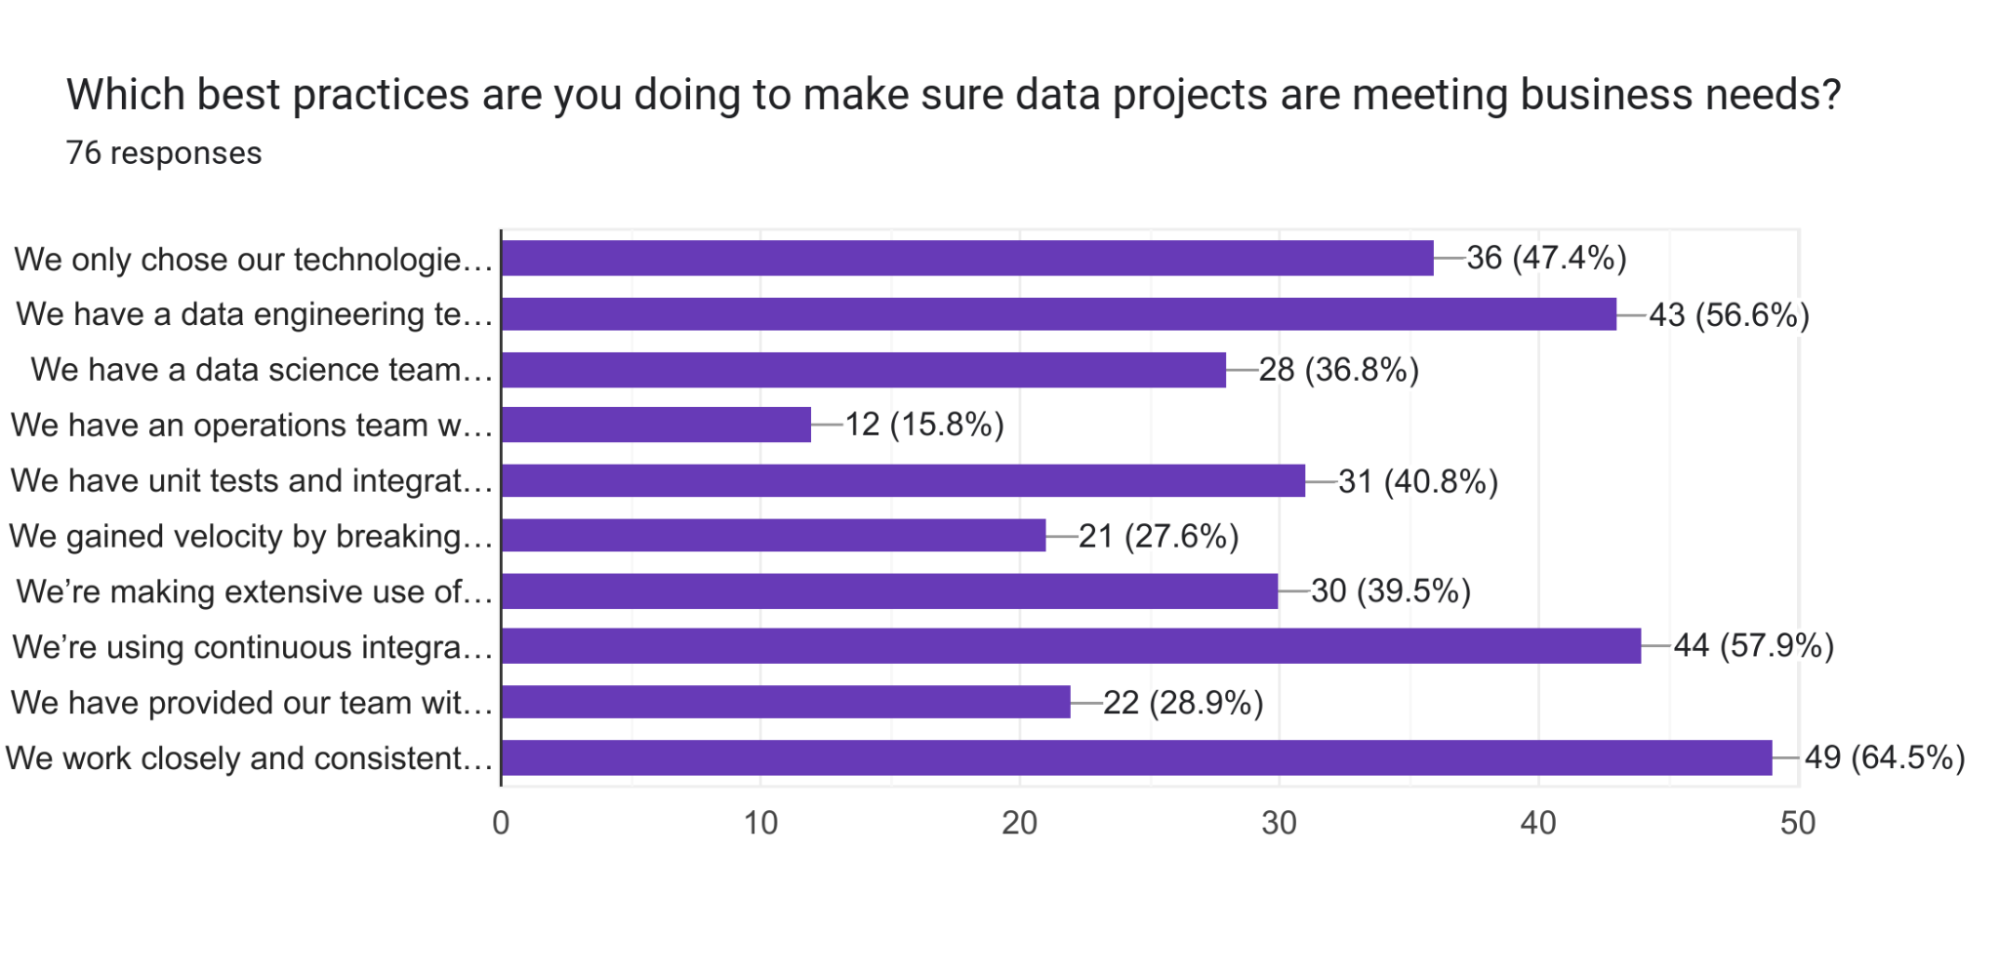
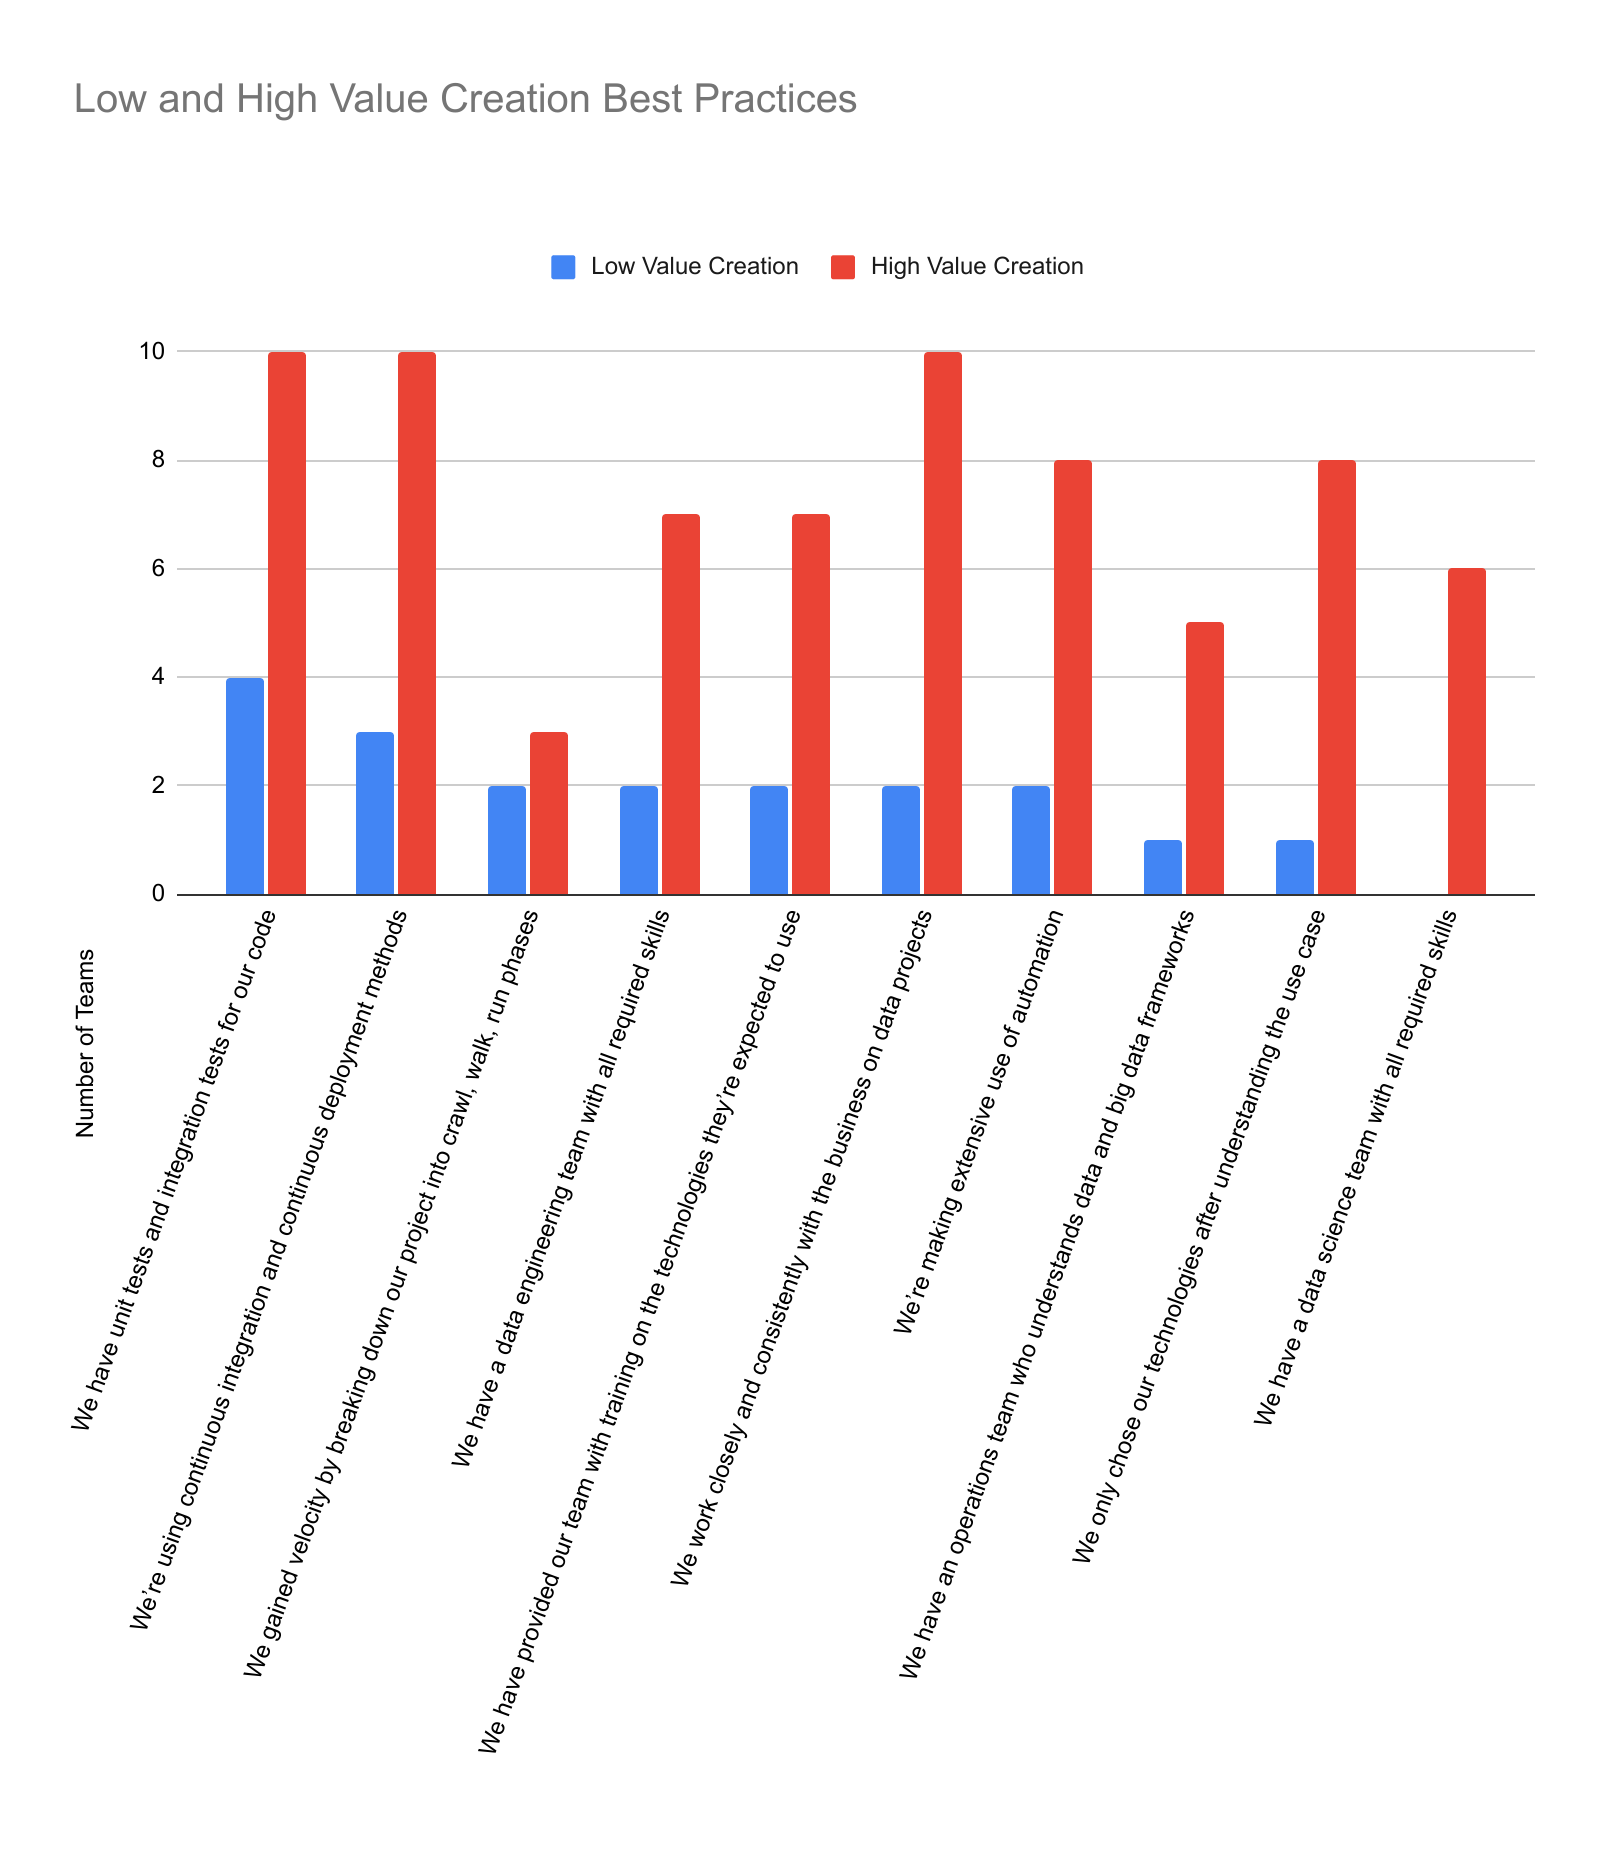
What is crucial for successful data projects?
Collaboration between data teams and the business side is crucial for successful data projects.
What is emphasized by companies increasing the size of their data teams?
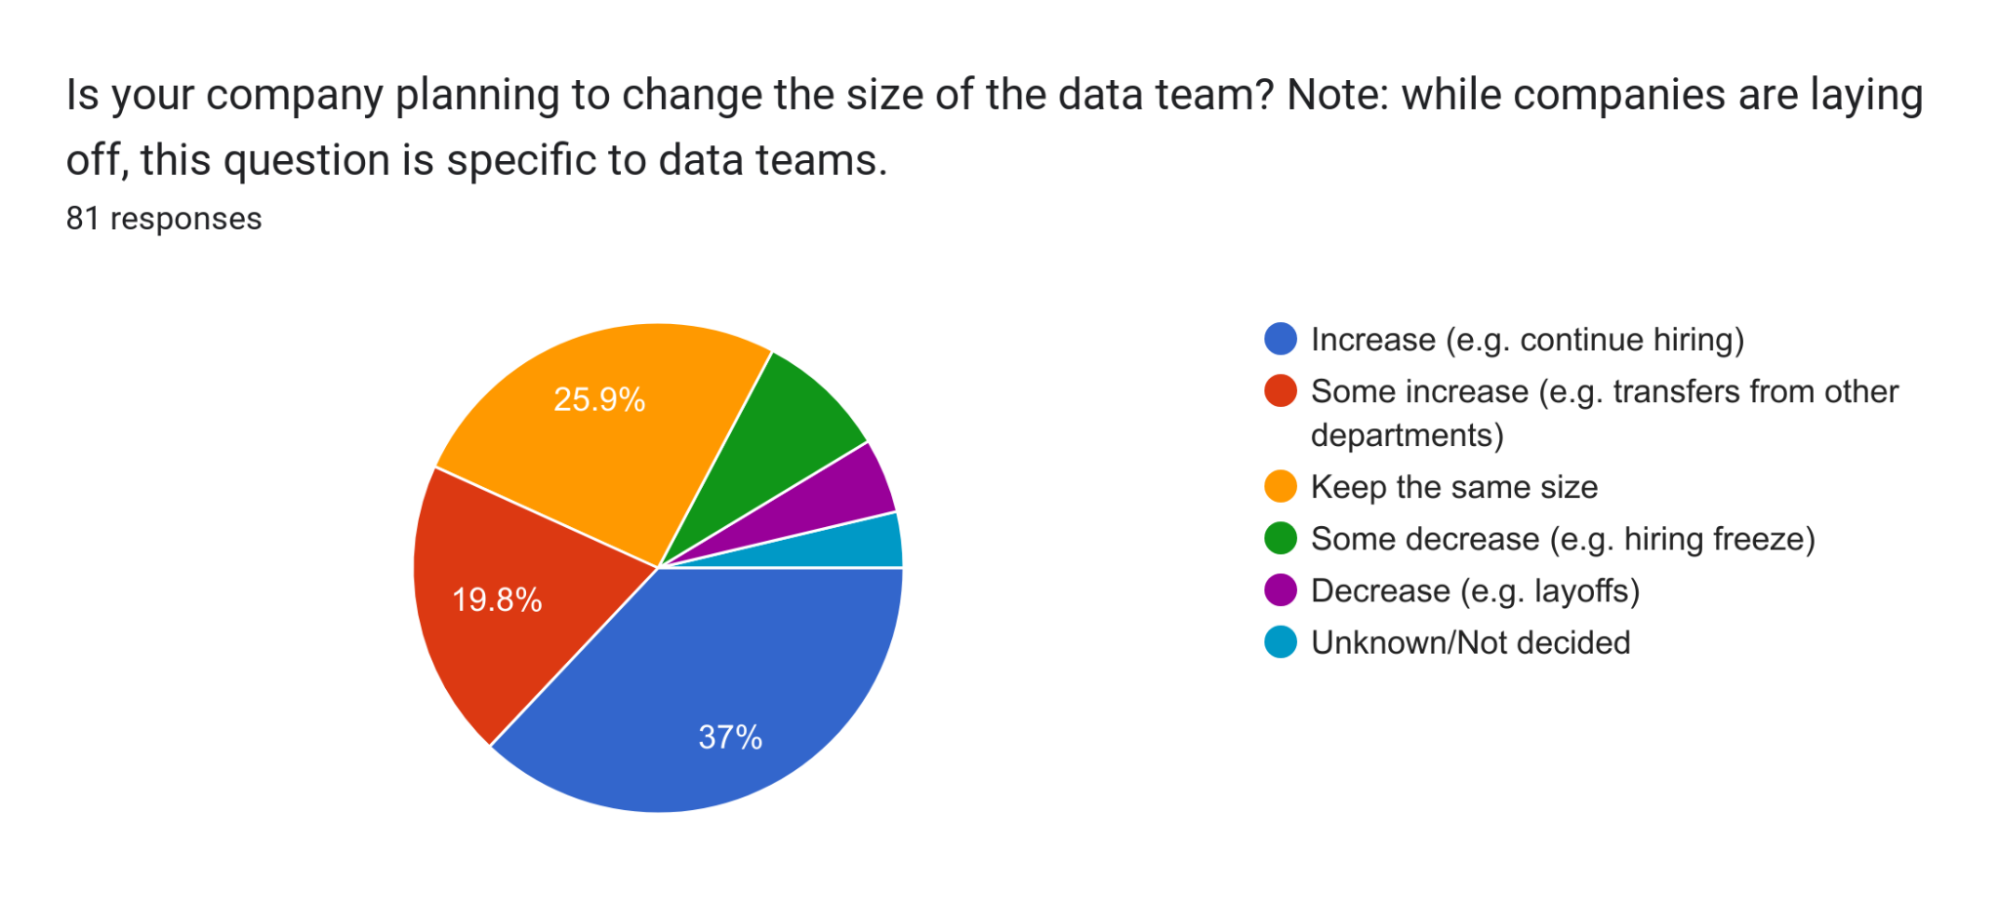
Companies are increasing the size of their data teams rather than decreasing them, emphasizing the importance of data teams in creating value.